Introduction
This article is part of a monthly series tailored for equity investors, analysts, and sector observers tracking South Korea’s export performance in semiconductors and IT products. As a global supply chain hub, Korea’s export trends often act as leading indicators of stock movements in major players such as Samsung Electronics, SK hynix, and a wide range of fabless, materials, and equipment firms.
Each month, we provide a breakdown of export data across key product categories—including DRAM, NAND flash, system semiconductors (Logic & Other ICs), semiconductor equipment, silicon components, smartphones, and display panels—to highlight developments that matter to the market.
In July 2025, DRAM and system semiconductor exports posted solid double-digit growth, fueled by demand from AI, servers, and high-performance mobile applications. Equipment and smartphone shipments also rebounded strongly. Meanwhile, NAND flash and display panels continued to struggle with pricing pressure and structural headwinds.
These dynamics reflect a growing divergence between next-gen technologies and legacy segments—a trend with meaningful implications for stock selection going forward.
Table of Contents
1. Summary of July Export (Preliminary)
2. Detailed Export by Category
- DRAM
- NAND Flash
- Logic & Other ICs (System semiconductors)
- Chip Equipment
- Silicon Components
- Smartphones
- Display Panels
3. July Summary & Key Insights
Summary of July Export (Preliminary)
Category | Type | Jul 2025 | Jun 2025 | Jul 2024 | YoY (%) | MoM (%) |
|---|---|---|---|---|---|---|
| DRAM | Monthly | 2,388 | 2,292 | 1,986 | +20.2 | +4.2 |
| 12M** | 24,214 | 23,812 | 18,177 | +33.2 | +1.7 | |
| NAND | Monthly | 469 | 621 | 536 | -12.6 | -24.5 |
| 12M | 5,756 | 5,824 | 8,117 | -29.1 | -1.2 | |
| Logic & Other ICs | Monthly | 4,695 | 3,995 | 3,896 | +20.5 | +17.5 |
| 12M | 48,616 | 47,818 | 46,337 | +4.9 | +1.7 | |
| Chip Equipment | Monthly | 532 | 427 | 380 | +39.9 | +24.6 |
| 12M | 4,321 | 4,169 | 3,517 | +22.9 | +3.6 | |
| Silicon Components | Monthly | 371 | 363 | 344 | +7.6 | +2.1 |
| 12M | 3,880 | 3,854 | 3,449 | +12.5 | +0.7 | |
| Smartphones | Monthly | 425 | 227 | 203 | +109.4 | +86.9 |
| 12M | 3,667 | 3,444 | 2,954 | +24.1 | +6.4 | |
| Display Panels | Monthly | 1,010 | 698 | 1,158 | -12.8 | +44.6 |
| 12M | 11,639 | 11,787 | 13,404 | -13.2 | -1.3 |
Source of data: https://www.bandtrass.or.kr
DRAM
- DRAM exports in July were USD 2,388 million, with YoY +20.2% and MoM +4.2%.
| Period | Export Value (M USD) | YoY (%) | MoM (%) | Remarks |
|---|---|---|---|---|
| July (Prelim) | 2,388 | +20.2 | +4.2 |
Related Stocks
- Samsung Electronics (KRX: 005930), SK hynix (KRX: 000660)

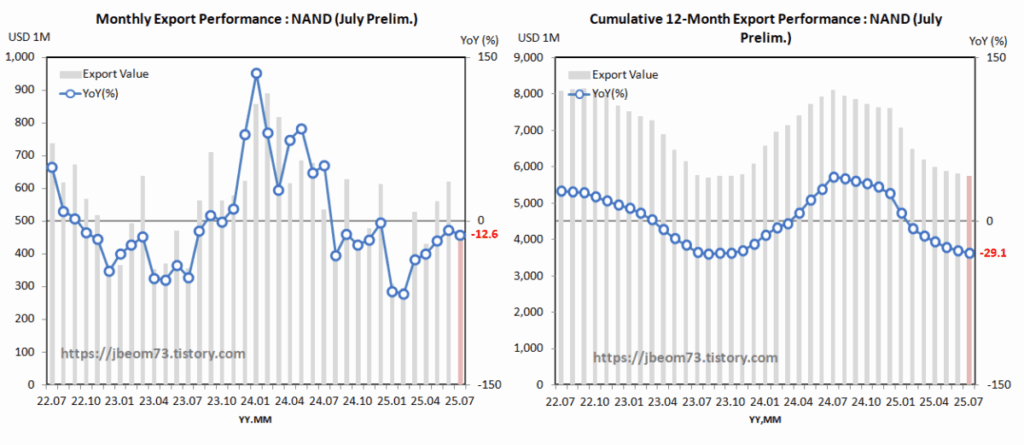
NAND Flash
- NAND exports amounted to USD 469 million, marking YoY -12.6% and MoM -24.5%.
| Period | Export Value (M USD) | YoY (%) | MoM (%) | Remarks |
|---|---|---|---|---|
| July (Prelim) | 469 | -12.6 | -24.5 | Decline |
Related Stocks
- Samsung Electronics (KRX: 005930), SK hynix (KRX: 000660)
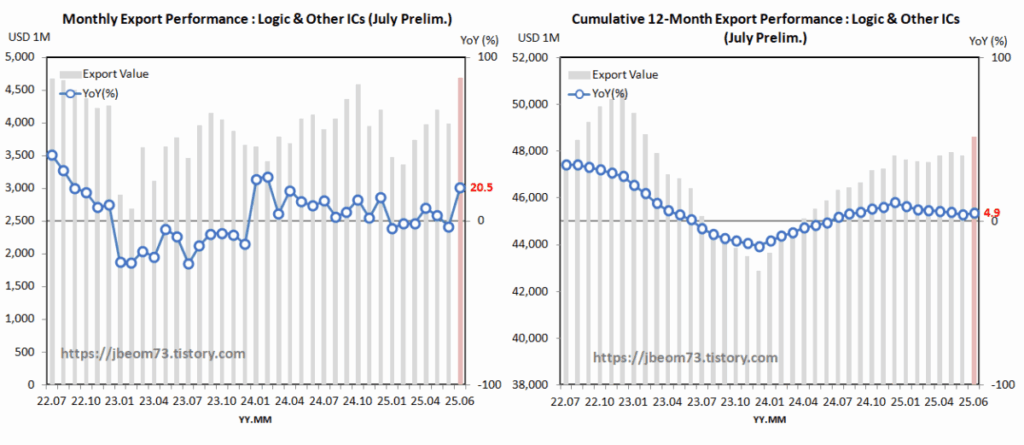
Logic & Other ICs (System semiconductors)
- System semiconductor exports hit USD 4,695 million in July, up +20.5% YoY and +17.5% MoM.
| Period | Export Value (M USD) | YoY (%) | MoM (%) | Remarks |
|---|---|---|---|---|
| July (Prelim) | 4,695 | +20.5 | +17.5 | Increase |
Related Stocks
- Samsung Electronics (KRX: 005930)
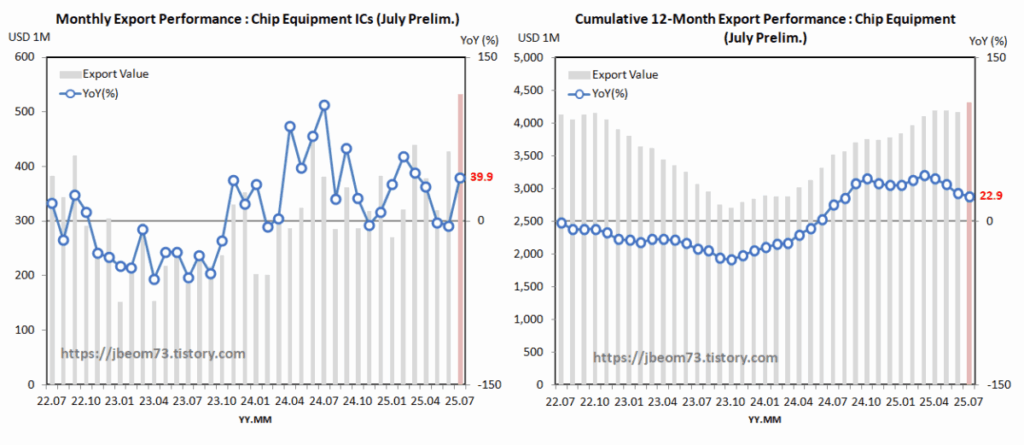
Chip Equipment
- Equipment exports recorded USD 532 million, up +39.9% YoY and +24.6% MoM.
| Period | Export Value (M USD) | YoY (%) | MoM (%) | Remarks |
|---|---|---|---|---|
| July (Prelim) | 532 | +39.9 | +24.6 | – |
Related Stocks
- Hanmi Semiconductor (KOSDAQ: 042700), Jusung Engineering (KOSDAQ: 036930), Wonik IPS (KOSDAQ: 240810), and Eugene Technology (KOSDAQ: 084370)
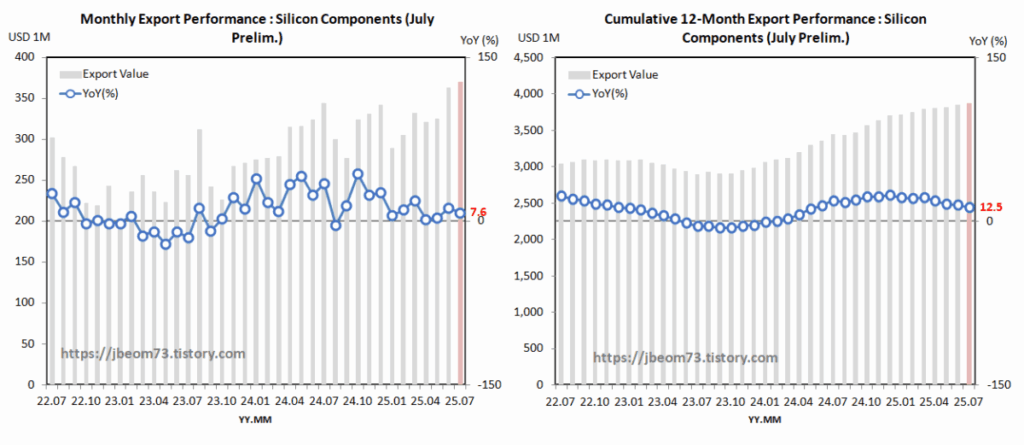
Silicon Components
- DRAM exports in July were USD 2,388 million, with YoY +20.2% and MoM +4.2%.
| Period | Export Value (M USD) | YoY (%) | MoM (%) | Remarks |
|---|---|---|---|---|
| July (Prelim) | 371 | +7.6 | +2.1 |
Related Stocks
- TCK (Tokai Carbon Korea Co., Ltd.; KOSDAQ: 064760), Hana Materials Co., Ltd. (KOSDAQ: 166090), and Woldex Co., Ltd. (KOSDAQ: 101160).
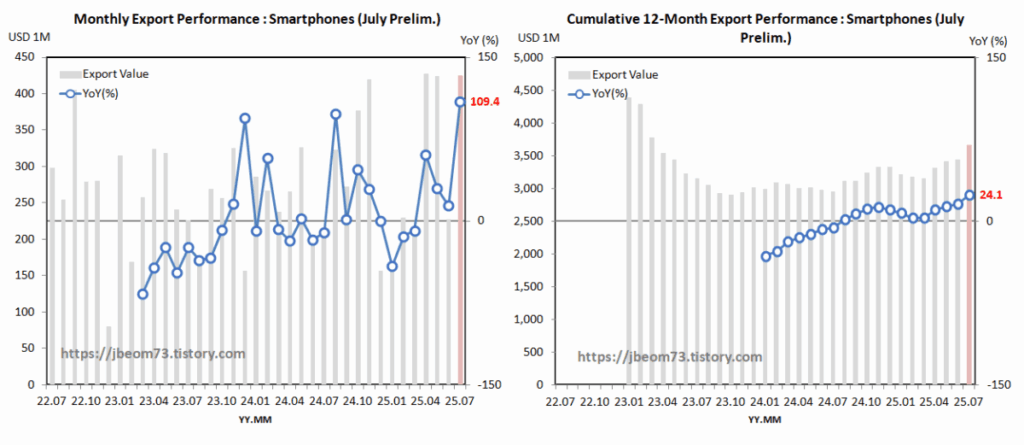
Smartphones
- Smartphone exports surged to USD 425 million, with YoY +109.4% and MoM +86.9%.
| Period | Export Value (M USD) | YoY (%) | MoM (%) | Remarks |
|---|---|---|---|---|
| July (Prelim) | 425 | +109.4 | +86.9 |
Related Stocks
- Samsung Electronics (KRX: 005930), Samsung Electro-Mechanics (KRX: 009150)
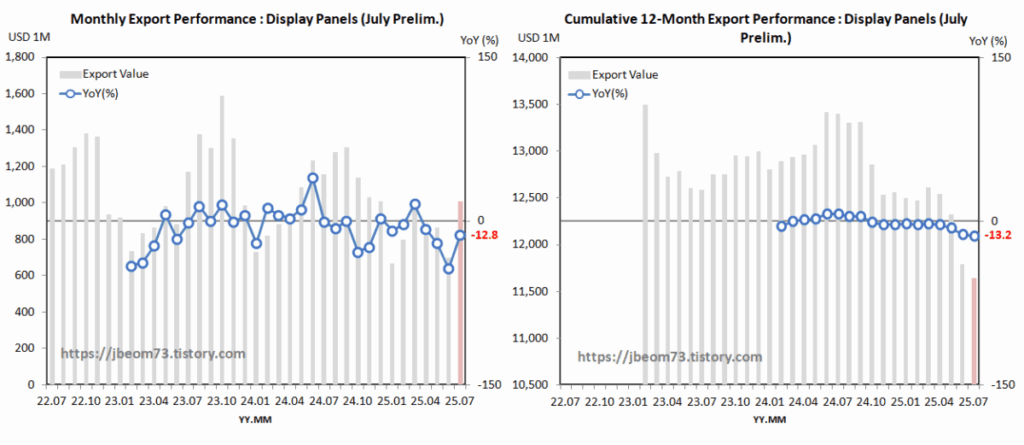
Display Panels
- Display exports reached USD 1,010 million, showing YoY -12.8% and MoM +44.6%.
| Period | Export Value (M USD) | YoY (%) | MoM (%) | Remarks |
|---|---|---|---|---|
| July-end (Prelim) | 1,010 | -12.8 | +44.6 |
Related Stocks
- LG Display (KRX: 034220), LX Semicon (KOSDAQ: 108320)
July Summary & Key Insights
1) Strong performance in memory (especially DRAM) and equipment
- Demand for AI, high-performance computing, and servers is boosting memory and advanced materials.
- Major customers like Samsung and SK resumed investments, driving sharp rebounds in equipment and component makers.
2) Weakness in traditional segments like NAND and displays persists
- Structural issues include declining price competitiveness, falling demand, and pressure from low-cost Chinese suppliers.
3) Progress in localization and export diversification of advanced materials
- Korea’s successful localization of materials like blank masks and photoresists is translating into export growth.
- Global supply chain competitiveness in materials and components is being strengthened.
4) Recovery in downstream industries (smartphones, automotive, IT devices, etc.)
- Demand for new products and automotive semiconductors is driving growth in system semiconductors, smartphones, and silicon wafers.
5) Key watchpoints for H2 2025
- US-China trade environment
- Semiconductor cycle (especially memory pricing)
- Impact of new IT products
- Resumption of global tech investment
App. HS Codes Used for Export Statistics by Product Category
- DRAM: 8542.32.1010
- NAND Flash: 8542.32.1030
- System Semiconductors: 8542.31, 8542.33, 8542.39
- Semiconductor Equipment: 8486.10, 8486.20, 8486.40
- Silicon Components: 8486.90
- Smartphones: 8517.13.0000
- LED Displays: 8524.12
Disclaimer:
The content of this post is for general informational purposes only and does not constitute investment advice. Any investment decisions made based on this content are at the reader’s own risk, and the author assumes no responsibility for any resulting losses.